Running A Load Test
We will use Cargo to run our example load test application. It's best to get in the habit of setting the --release option whenever compiling or running load tests.
$ cargo run --release
    Finished release [optimized] target(s) in 0.06s
     Running `target/release/loadtest`
07:08:43 [INFO] Output verbosity level: INFO
07:08:43 [INFO] Logfile verbosity level: WARN
07:08:43 [INFO] users defaulted to number of CPUs = 10
Error: InvalidOption { option: "--host", value: "", detail: "A host must be defined via the --host option, the GooseAttack.set_default() function, or the Scenario.set_host() function (no host defined for LoadtestTransactions)." }
The load test fails with an error as it hasn't been told the host you want to load test.
So, let's try again, this time passing in the --host flag. We will also add the --report-file flag with a .html file extension, which will generate an HTML report, and --no-reset-metrics to preserve all information including the load test startup. The same information will also be printed to the command line (without graphs). After running for a few seconds, press ctrl-c one time to gracefully stop the load test:
% cargo run --release -- --host http://umami.ddev.site --report-file=report.html --no-reset-metrics
    Finished release [optimized] target(s) in 0.06s
     Running `target/release/loadtest --host 'http://umami.ddev.site' --report-file=report.html --no-reset-metrics`
08:53:48 [INFO] Output verbosity level: INFO
08:53:48 [INFO] Logfile verbosity level: WARN
08:53:48 [INFO] users defaulted to number of CPUs = 10
08:53:48 [INFO] no_reset_metrics = true
08:53:48 [INFO] report_file = report.html
08:53:48 [INFO] global host configured: http://umami.ddev.site
08:53:48 [INFO] allocating transactions and scenarios with RoundRobin scheduler
08:53:48 [INFO] initializing 10 user states...
08:53:48 [INFO] Telnet controller listening on: 0.0.0.0:5116
08:53:48 [INFO] WebSocket controller listening on: 0.0.0.0:5117
08:53:48 [INFO] entering GooseAttack phase: Increase
08:53:48 [INFO] [user 1]: launching user from LoadtestTransactions
08:53:49 [INFO] [user 2]: launching user from LoadtestTransactions
08:53:50 [INFO] [user 3]: launching user from LoadtestTransactions
08:53:51 [INFO] [user 4]: launching user from LoadtestTransactions
08:53:52 [INFO] [user 5]: launching user from LoadtestTransactions
08:53:53 [INFO] [user 6]: launching user from LoadtestTransactions
08:53:54 [INFO] [user 7]: launching user from LoadtestTransactions
08:53:55 [INFO] [user 8]: launching user from LoadtestTransactions
08:53:56 [INFO] [user 9]: launching user from LoadtestTransactions
08:53:57 [INFO] [user 10]: launching user from LoadtestTransactions
All 10 users hatched.

08:53:58 [INFO] entering GooseAttack phase: Maintain
^C08:54:25 [WARN] caught ctrl-c, stopping...
As of Goose 0.16.0, by default all INFO and higher level log messages are displayed on the console while the load test runs. You can disable these messages with the -q (--quiet) flag. Or, you can display low-level debug with the -v (--verbose) flag.
HTML report
When the load tests finishes shutting down, it will display some ASCII metrics on the CLI and an HTML report will be created in the local directory named report.html as was configured above. The graphs and tables found in the HTML report are what are demonstrated below:
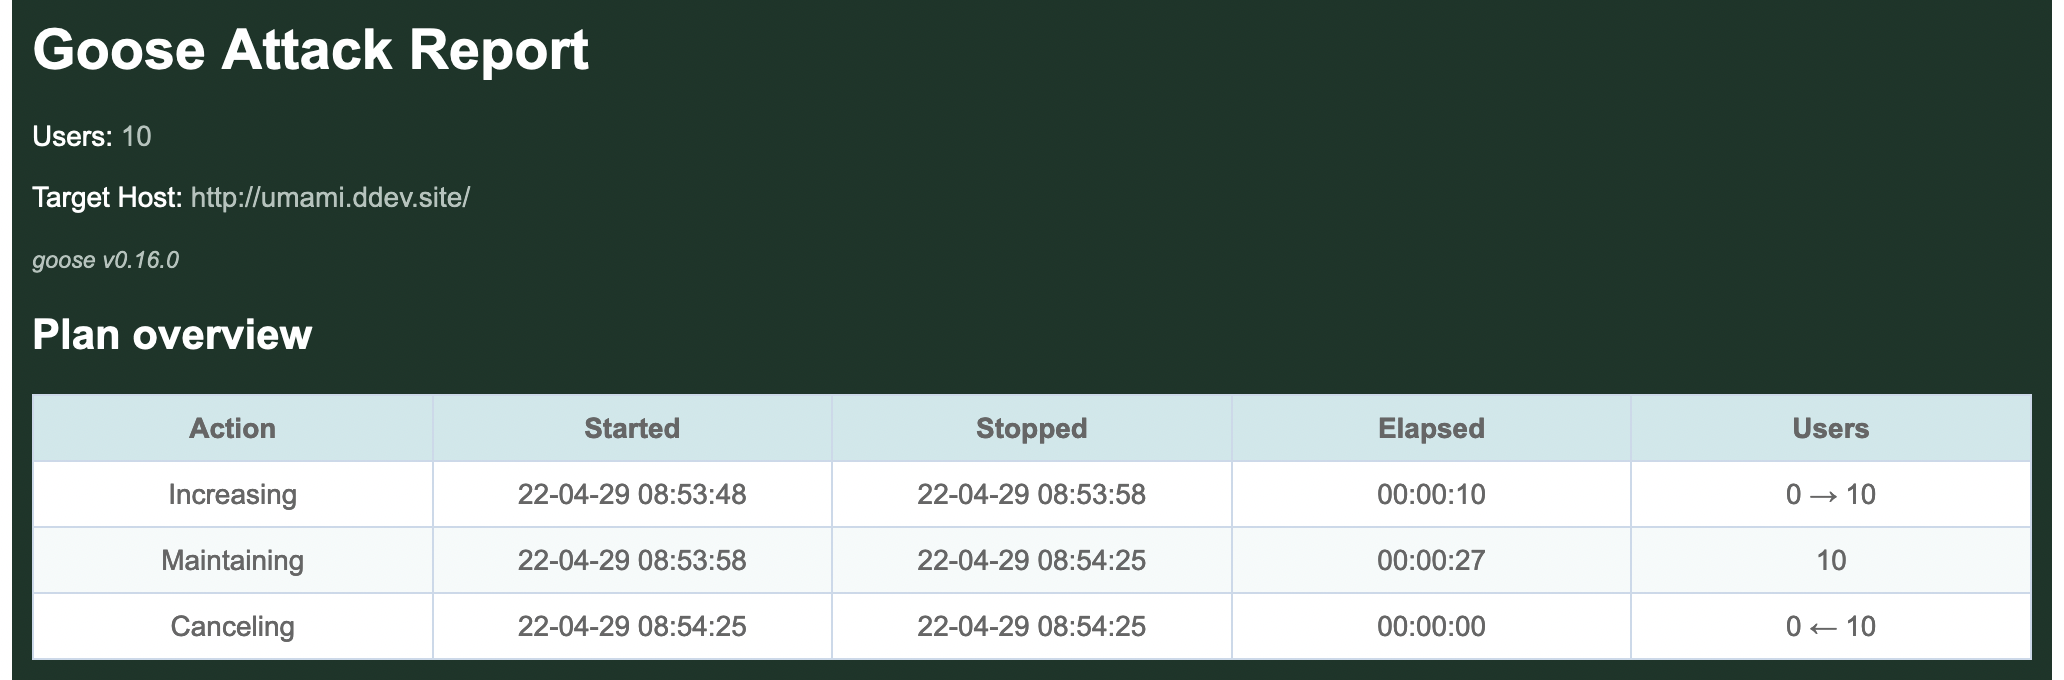
By default, Goose will hatch 1 GooseUser per second, up to the number of CPU cores available on the server used for load testing. In the above example, the loadtest was run from a laptop with 10 CPU cores, so it took 10 seconds to hatch all users.
By default, after all users are launched Goose will flush all metrics collected during the launching process (we used the --no-reset-metrics flag to disable this behavior) so the summary metrics are collected with all users running. If we'd not used --no-reset-metrics, before flushing the metrics they would have been displayed to the console so the data is not lost.
Request metrics
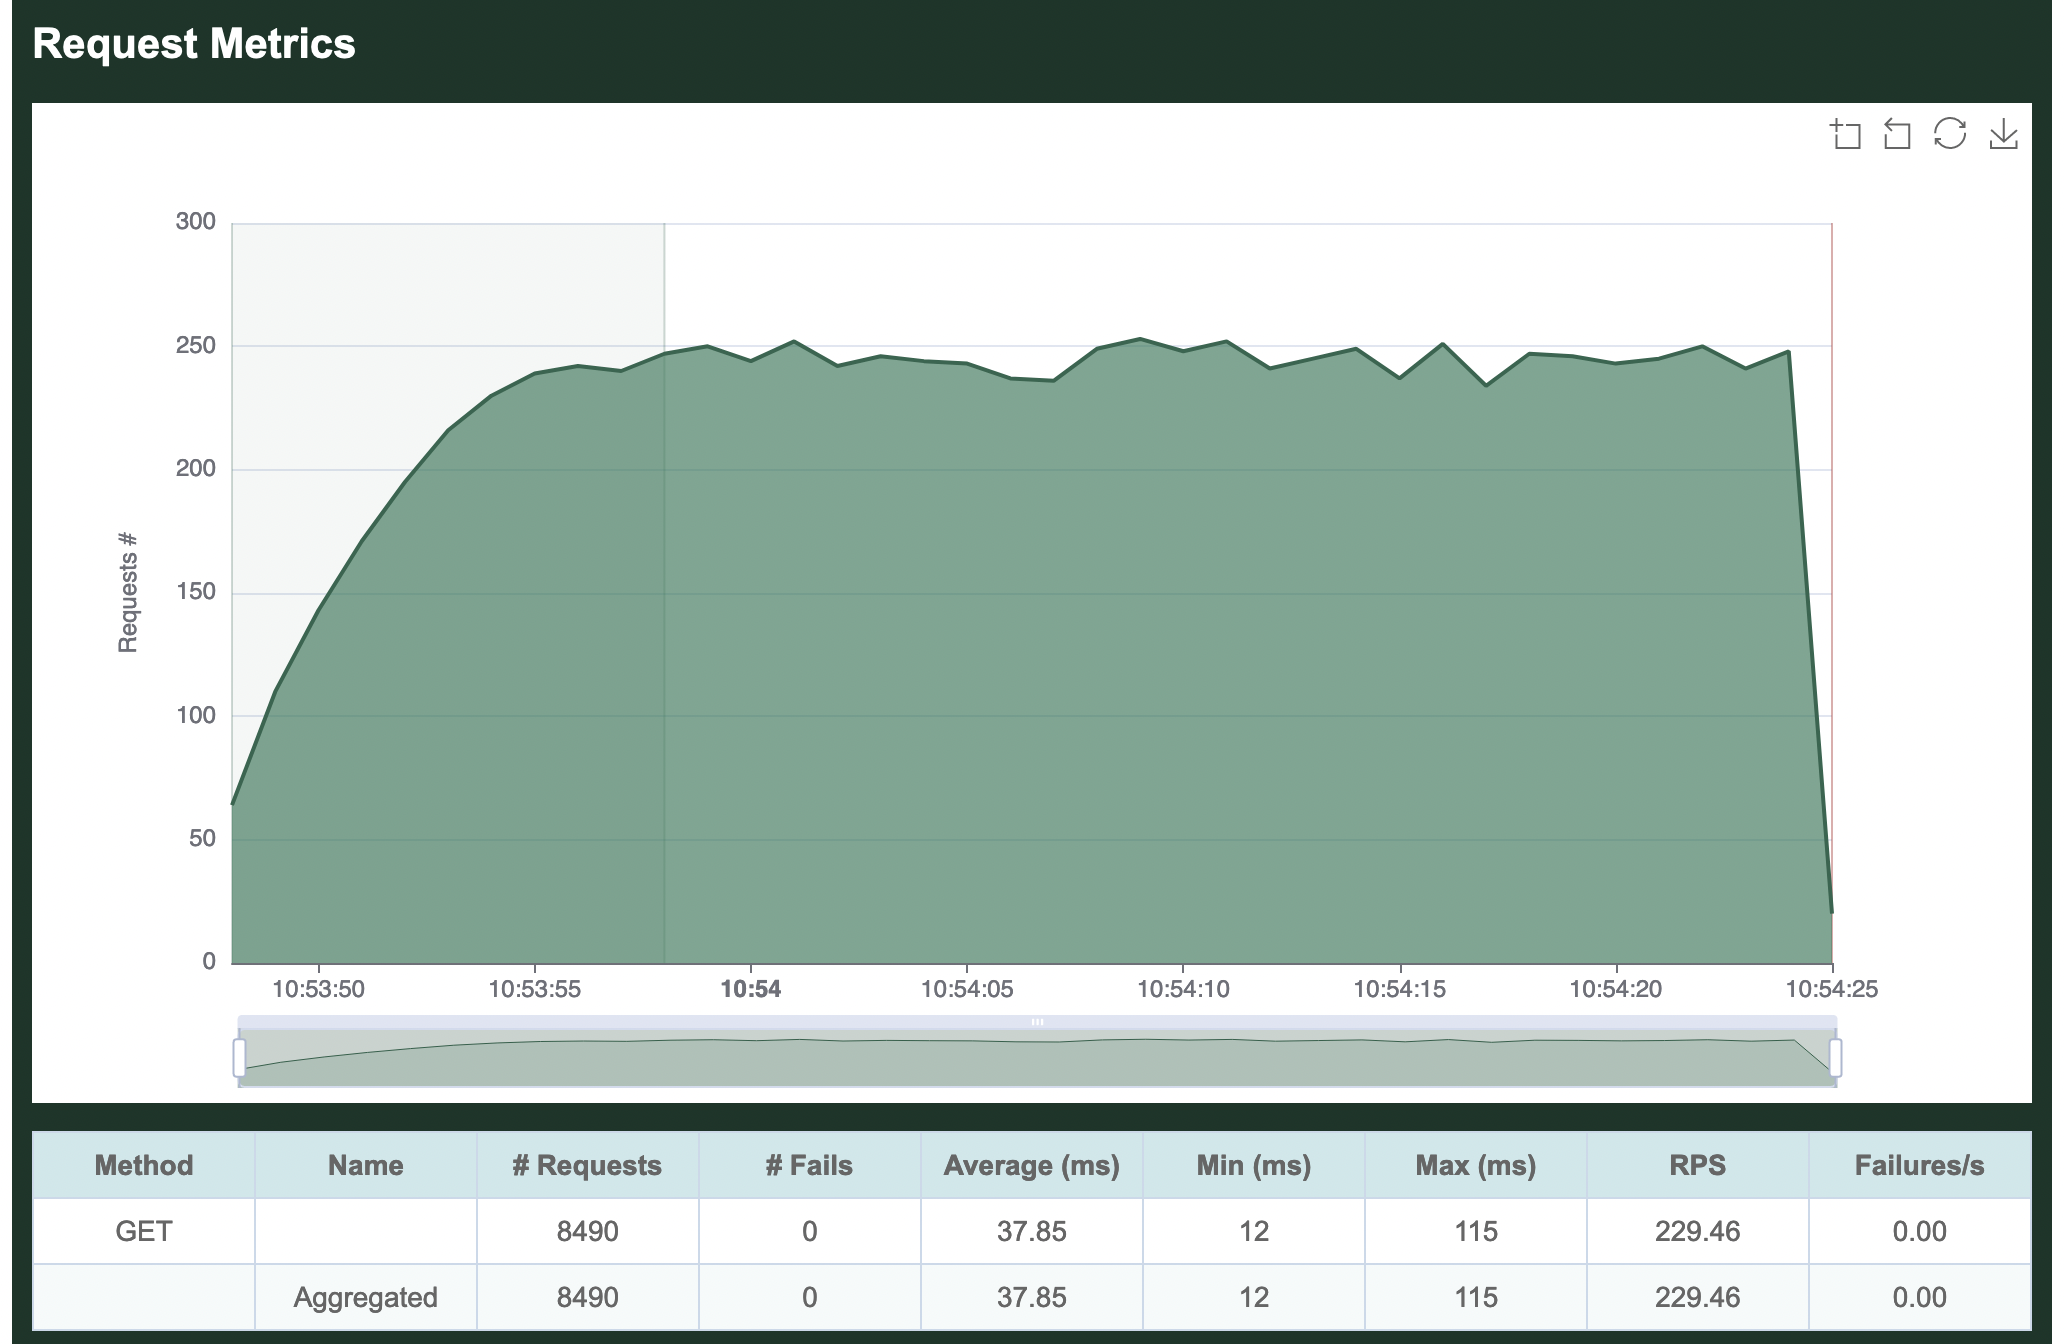
The per-request metrics are displayed first. Our single transaction makes a GET request for the empty "" path, so it shows up in the metrics as simply GET . The table in this section displays the total number of requests made (8,490), the average number of requests per second (229.46), and the average number of failed requests per second (0).
Additionally it shows the average time required to load a page (37.85 milliseconds), the minimum time to load a page (12 ms) and the maximum time to load a page (115 ms).
If our load test made multiple requests, the Aggregated line at the bottom of this section would show totals and averages of all requests together. Because we only make a single request, this row is identical to the per-request metrics.
Response time metrics
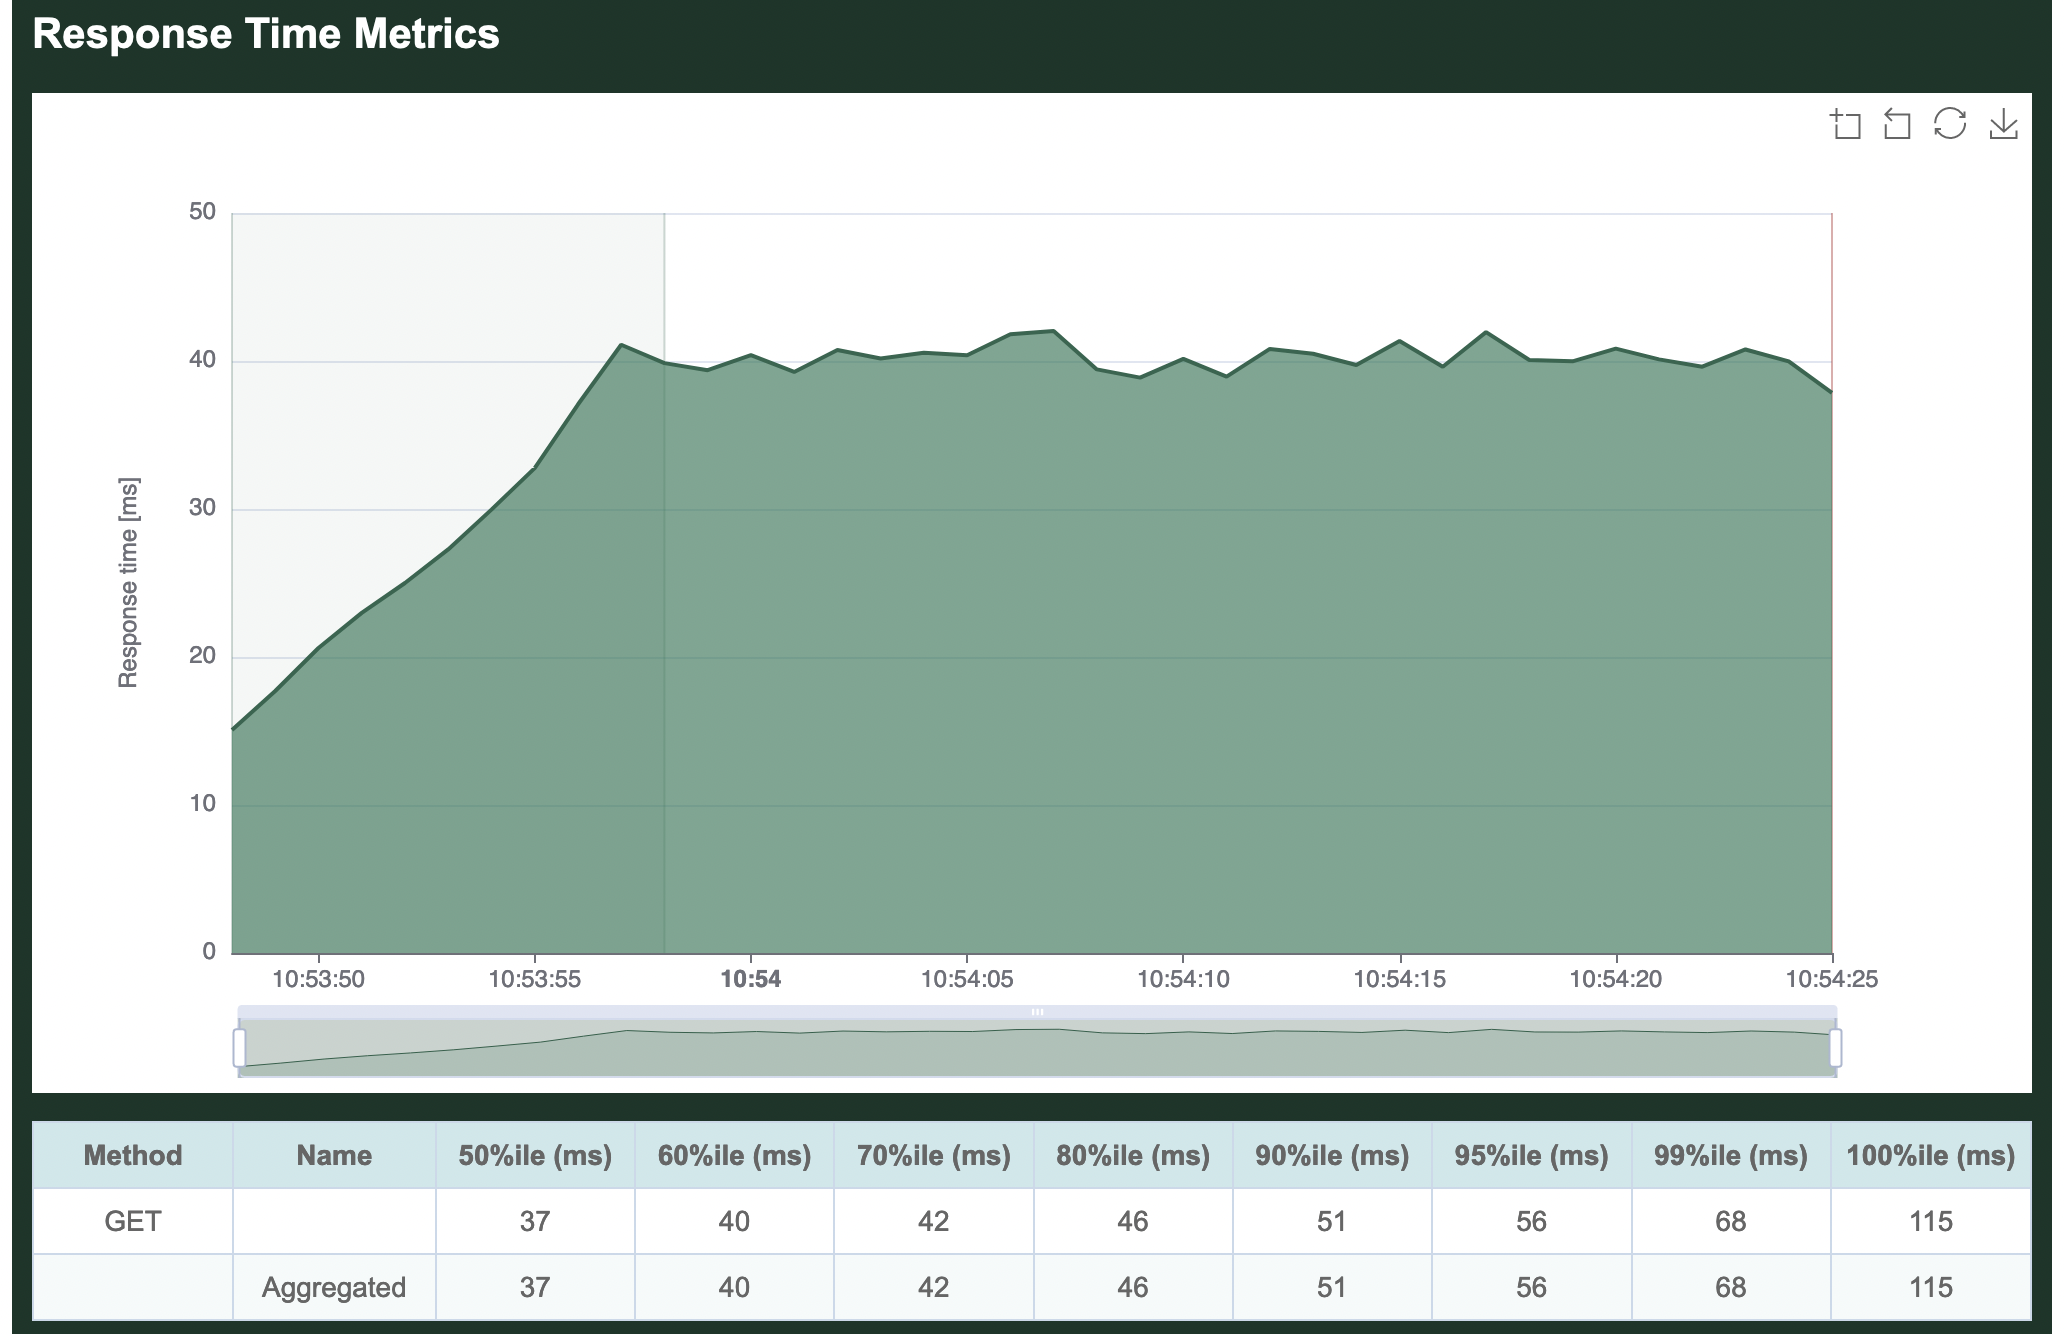
The second section displays the average time required to load a page. The table in this section is showing the slowest page load time for a range of percentiles. In our example, in the 50% fastest page loads, the slowest page loaded in 37 ms. In the 70% fastest page loads, the slowest page loaded in 42 ms, etc. The graph, on the other hand, is displaying the average response time aggregated across all requests.
Status code metrics
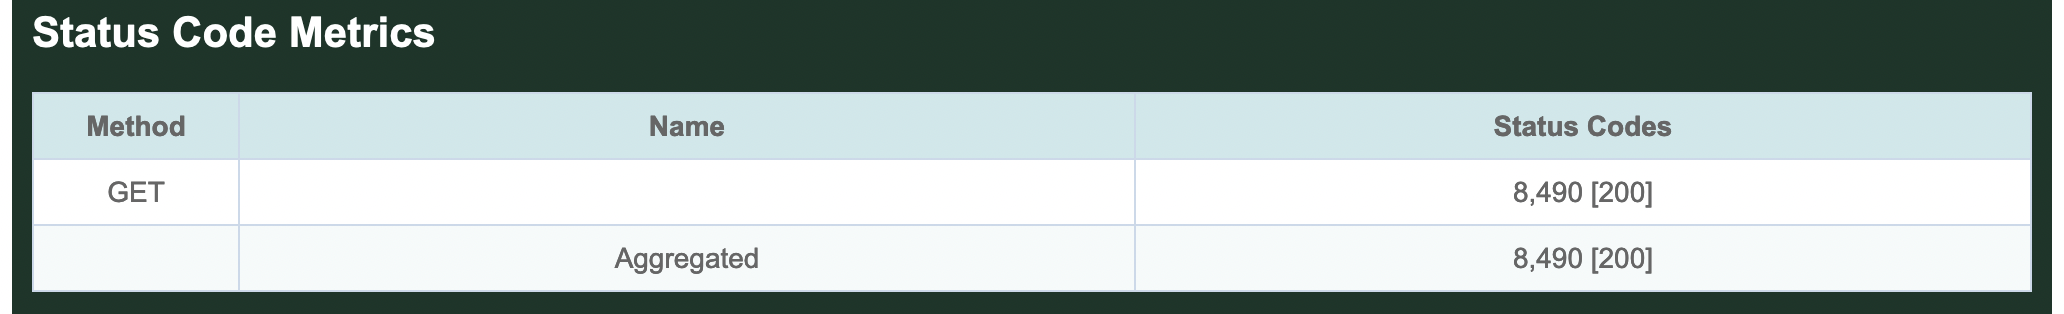
The third section is a table showing all response codes received for each request. In this simple example, all 8,490 requests received a 200 OK response.
Transaction metrics
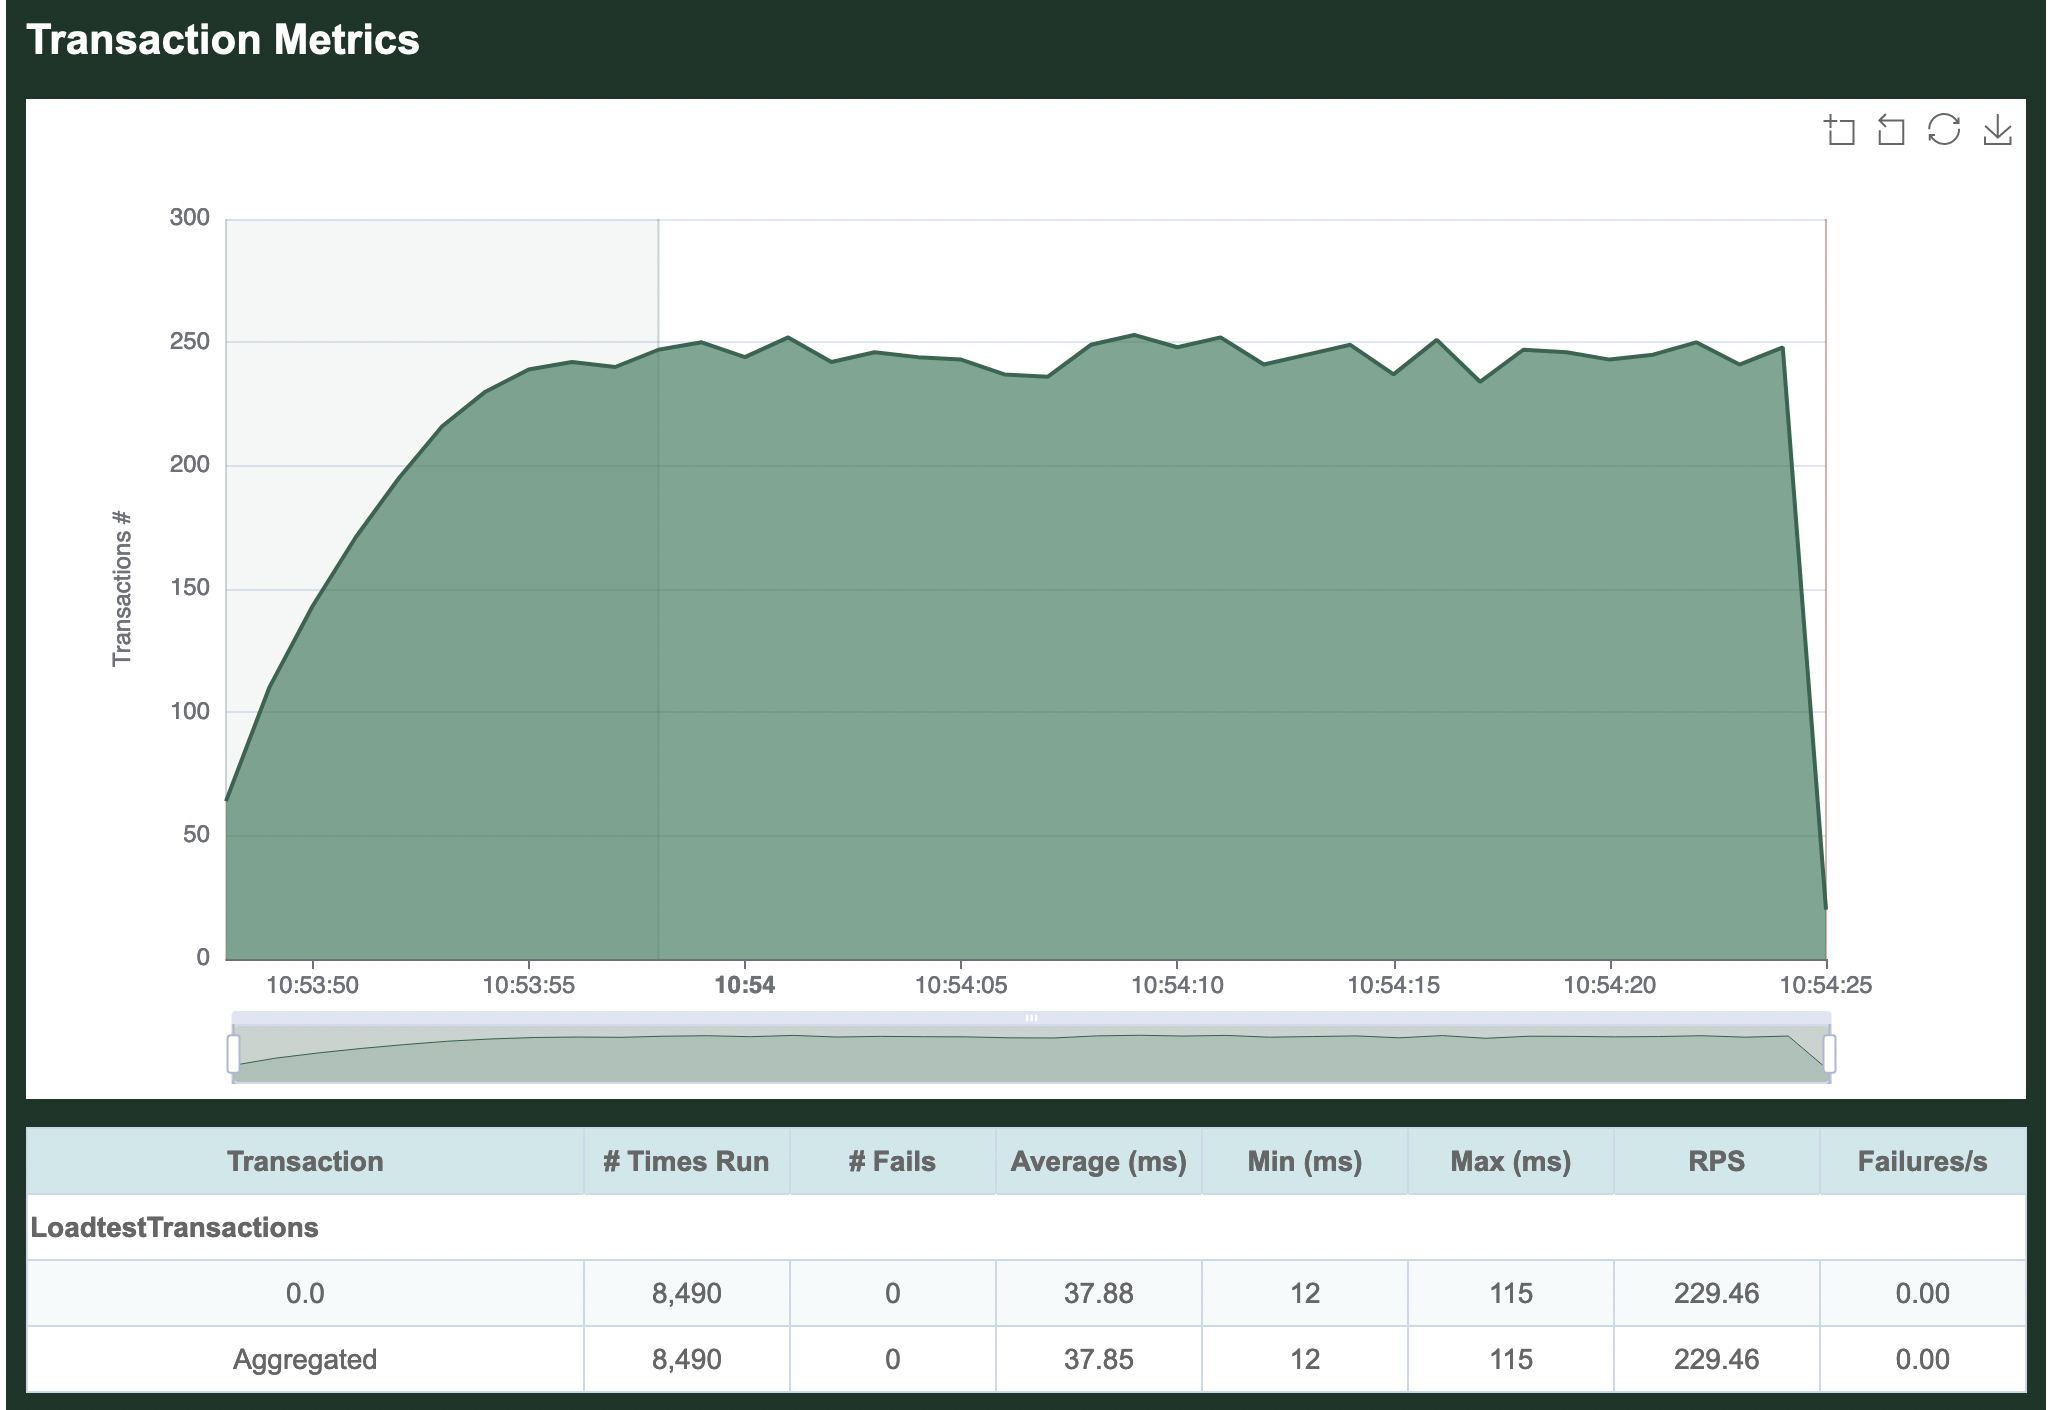
Next comes per-transaction metrics, starting with the name of our Scenario, LoadtestTransactions. Individual transactions in the Scenario are then listed in the order they are defined in our load test. We did not name our transaction, so it simply shows up as 0.0. All defined transactions will be listed here, even if they did not run, so this can be useful to confirm everything in your load test is running as expected. Comparing the transaction metrics metrics collected for 0.0 to the per-request metrics collected for GET /, you can see that they are the same. This is because in our simple example, our single transaction only makes one request.
In real load tests, you'll most likely have multiple scenarios each with multiple transactions, and Goose will show you metrics for each along with an aggregate of them all together.
Scenario metrics
Per-scenario metrics follow the per-transaction metrics. This page has has not yet been updated to include a proper example of Scenario metrics.
User metrics
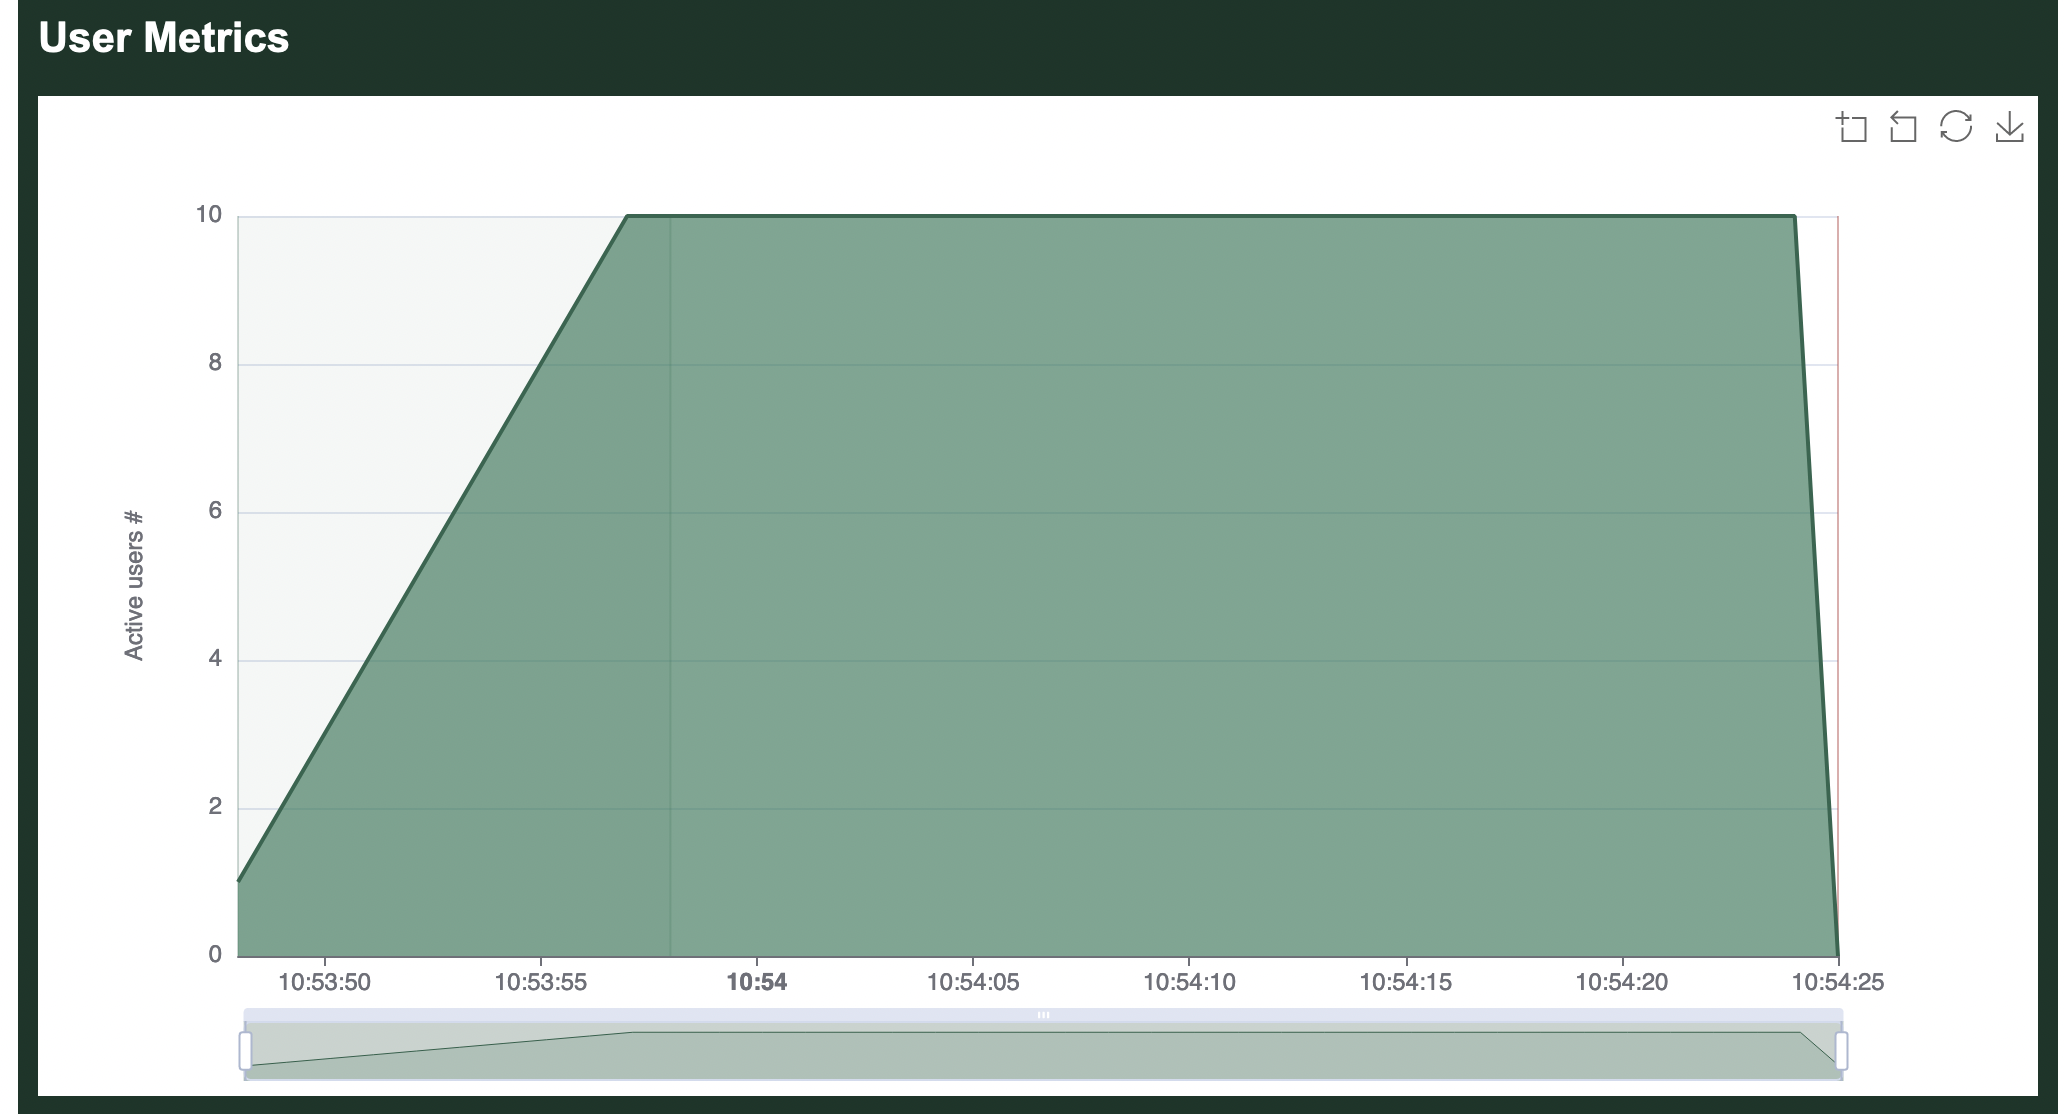
Finally comes a chart showing how many users were running during the load test. You can clearly see the 10 users starting 1 per second at the start of the load test, as well as the final second when users quickly stopped.
Refer to the examples included with Goose for more complicated and useful load test examples.